All projects:
- Python 3 was used for all projects unless otherwise noted.
- Used models from SciKit-Learn unless otherwise noted.
- All projects utilized CRISP-DM methodology
- Sorted with most recent projects first
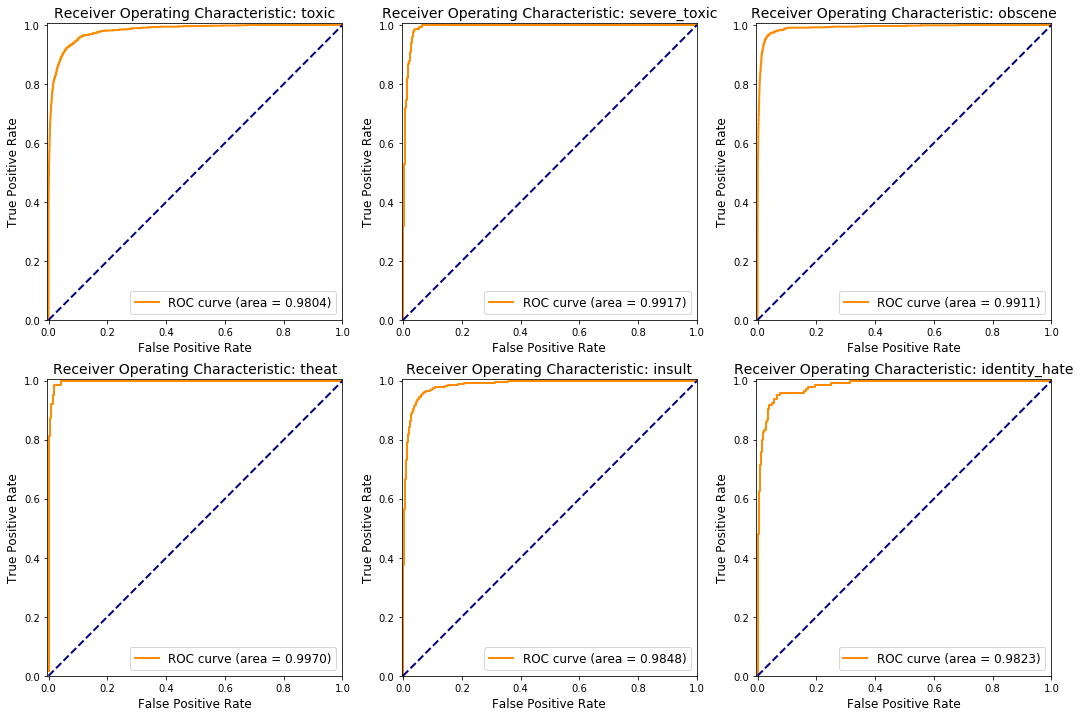
Kaggle / Google Jigsaw Toxic Comment Classification Contest
- Tools Used: NLP, Classifier, Python 3.6, Keras, Tensorflow, AWS, GPU, RNN, Sequence Model, GRU, Feature Engineering, GloVe, TF-IDF
- Summary: Made a classifier that predicted if a comment was one or more categories of toxic. Scoring metric was ROC AUC and I finished with an average ROC AUC of 98.2%. 1st Place was ROC AUC of 98.88%. Evaluated several forms of vectorizing words and word embeddings. Evaluated many types of models but final solution was a bi-directional GRU Recurrent Neural Network. Used AWS EC2 p2.xlarge GPU accelerated instance.
Blog Post on Feature Engineering/EDA
Project Details and Source Code
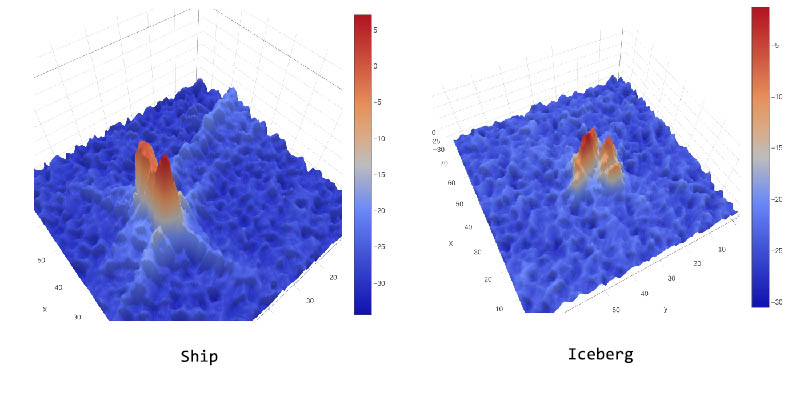
Kaggle Statoil Iceberg/Ship Classification Contest
- Tools Used: Python 3.5, Keras, Tensorflow, AWS, GPU, ConvNet, Data Augmentation
- Summary: Made a classifier that took radar data from a satellite and predicted if an object was a ship or an iceberg. Placed in top 10% of competitors with accuracy exceeding 95%. Used AWS EC2 hardware with GPU acceleration. Made and evaluated several architectures of convolutional neural networks. Experimented with different types of signal processing for radar data as well as data augmentation for models.
Project Details and Source Code
Smartphone User Data Cleaning and Formatting
- Tools Used: Python 2.7, JSON, tarfile, gunzip, Matplotlib
- Summary: Taking in several TB of smart phone data from CrowdSignals.IO, modifying/fixing some values in the data, then filtering the data based on labels that exist in other files. Project consists of many relatively small JSON files (5KB to 10MB) that are stored in large (8+GB compressed) .tar.gz files.
Atlantic Hurricane Animated Data Visualizations
- Tools Used: Python 2.7, overextended Matplotlib, Numpy, FFMpeg, custom FFMpeg Python wrapper
- Summary: As global warming heats up the oceans there is more energy that can power hurricanes. This project was inspired by a /r/dataisbeautiful post on Reddit. I first tried to recreate the original post and then improve on it. Eventually I created 4 different visualizations that were rendered using Matplotlib and my FFMpeg wrapper. More information here
Home Price Prediction: Ames, IA
- Tools used: Python 2.7, Selenium scraping/munging, EDA, stacked ensemble, feature engineering, model experimentation, kaggle-like project, PostGreSQL
- Summary: Inspired by a meetup presentation implemented home price regressor using Ames, Iowa dataset. Scraped additional data from Story County Assessor website (Ames’ county) to create new features and SQL to manipulate/store data.
Indie Game Recommender (Capstone Project)
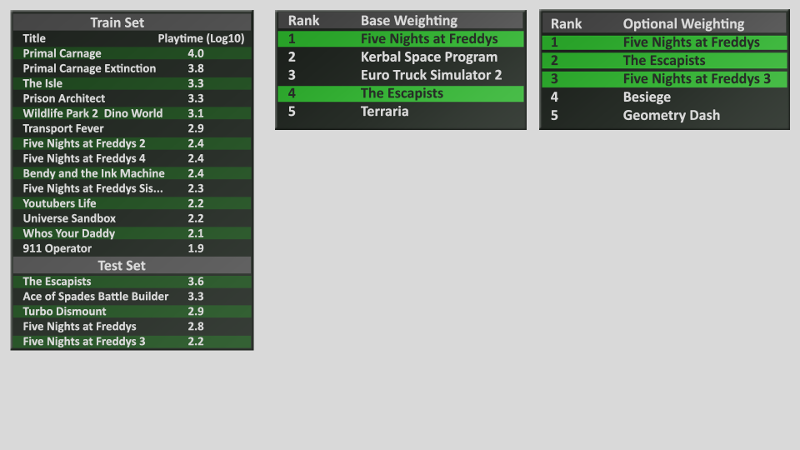
- Tools used: Python 2.7, BeautifulSoup, Selenium, AWS EC2/S3, MongoDB, EDA, Spark/PySpark, Spark MLLib NMF ALS explicit/implicit, rating weighting system, model serialization, capstone presentation
- Summary: Scraped 3M web pages in 5+ rounds of iteration, wrangled data with MongoDB workflow, ultimately predicted using ~10M rows of data, switched from explicit ratings to implicit ratings (log10 playtime) which ended up improving predictions quite a bit, presented capstone project to audience > 50. Serialized model for flask website but have not yet implemented front end.
Case Studies During Bootcamp:
Classify Phone Apps Based on Text Descriptions (1hr assessment)
- Tools used tfidf vectorizer, NLP, Multinomial Naive Bayes Classifier
- Summary: For a 1hr test used sklearn’s tfidfvectorizer with basic stop words to get a sparse matrix which was then fed into a MultinomialNB classifier. 92% mean accuracy (of 5 runs) solution / explanation
Event Planning Fraud Detection
- Tools used: gradient boosting classifier, recall optmized, serialized model, confusion matrices, ROC, flask website, AWS EC2
- Summary: In two days built a web dashboard that showed events that had the highest predicted fraud as well as cost (downside) to the company to help client staff use their anti-fraud time more effectively
Ride Sharing App Churn Prediction
- Tools used: logistic regression, confusion matrices, profit curves (LTV vs CAC), ROC
- Summary: Prioritized optimizing recall instead of accuracy as downsides of incorrect predictions had the biggest impact
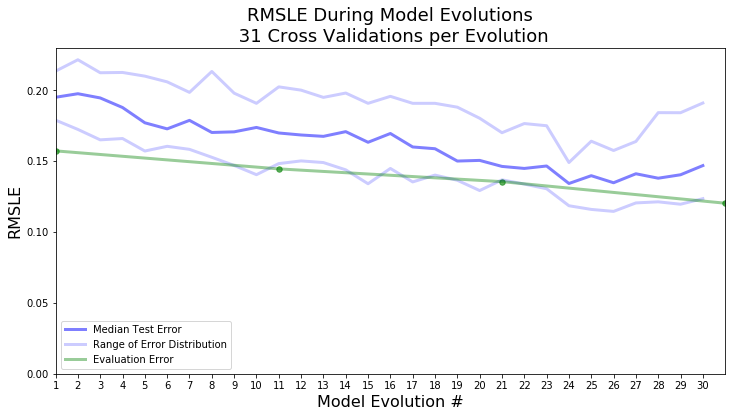
Predict Sale Price of Used Heavy Machinery at Auction
- Tools Used: linear regression, feature engineering, RMSLE
- Summary: First attempt at modeling and feature engineering, log transformation of the sale price had a huge impact on lowering the error rate